Operating Fundamentals
Now is the time to buy multifamily real estate.
With over twenty years’ experience in multifamily real estate investing and a team with $3.5B of transaction volume, we at Faulkner Capital Partners have learned how to invest in the right markets at the right time.
To discuss market timing, we must review three main factors…
1. Capital Markets/Macroeconomic – factors that affect the cost of capital (to buy and own) and liquidity (ability to sell) of multifamily real estate.
2. Multifamily Operating Fundamentals – factors that affect the performance of the cash flows of multifamily assets.
3. National, State, and Local Regulatory Risks
The variables that influence these factors can be tracked! And since the nature of real estate provides for a slow transaction process…it gives the ability to see the relevant indicators relating to cyclical trends almost in Real Time!
MULTIFAMILY OPERATING FUNDAMENTALS – Market Timing Factor 2
Multifamily real estate values are also heavily affected by the amount of new multifamily supply that is delivered into a market. Demand is very important as well but primarily in the short term. The market’s reaction to demand (in terms of the amount of supply delivered) is what ultimately drives rent growth and the direction of multifamily real estate values over the mid and long term.
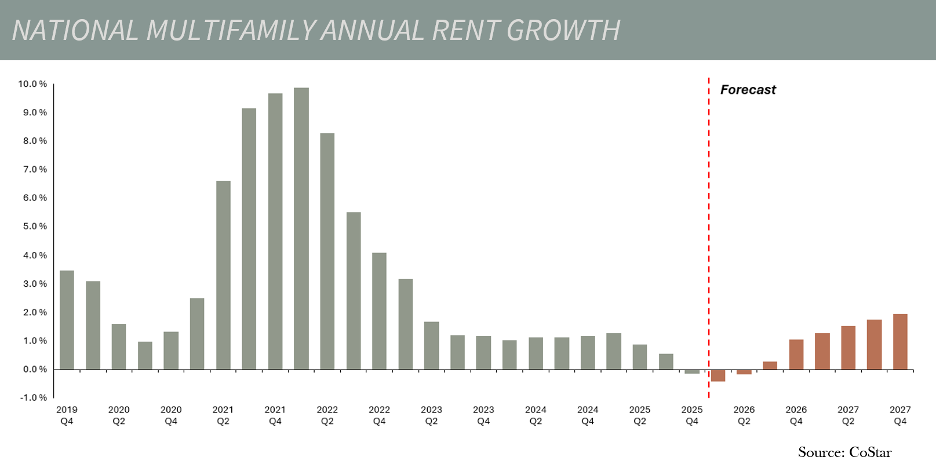
As can be seen in the graphs, national multifamily rent growth is down and forecasted to turn negative.
RENTS HAVE DECLINED RECENTLY DUE TO:
1. Extended growth period resulting in multiple years of exorbitant rent growth. This attracted developers to build new multifamily product.
2. Developers will supply for as long as they can and until the market forces them to stop. In an extended growth period, and one further embellished by post COVID inflation and demand, developers kept building!

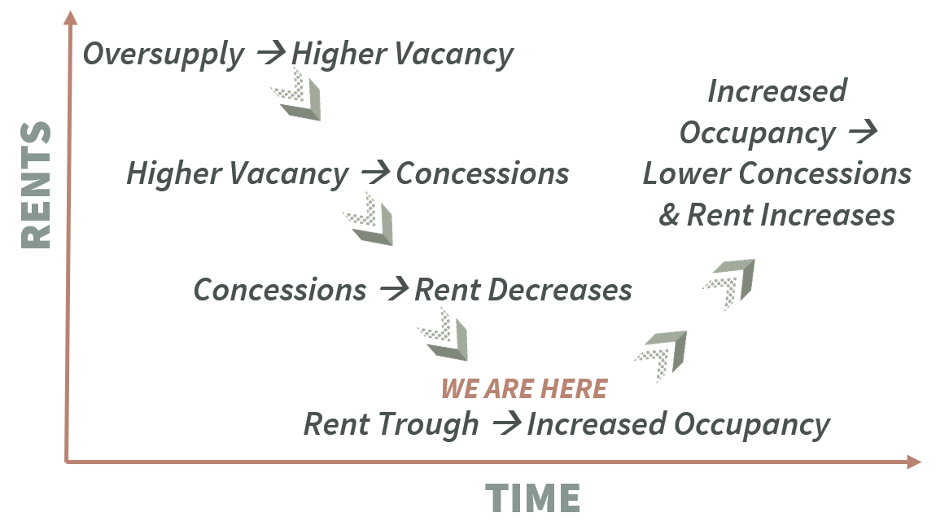
Oversupply tips the system out of balance. As concessions creep in, they bring effective rents down until a trough is reached.
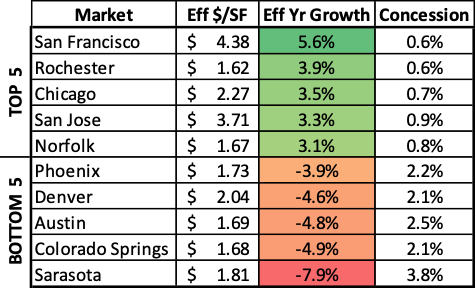
Not all markets are created equally. Differences in risk profiles, supply pipelines, operating indicators, job growth, and regulatory policies cause each metro to reset on its own timetable. The graphs shown here are national and represent an average of all markets. Currently, these markets are all performing differently. The table below shows effective rent growth over the last year for the top 5 and bottom 5 markets in the nation.
We at Faulkner Capital Partners use the data and what each indicator is telling us to sequence market entry and exit.